Configuring OpenTelemetry in API Gateway
Configuring OpenTelemetry (OTel) at the Gateway level establishes the global data delivery pipelines, authentication headers, and network export settings for your runtime. These settings are the master configuration you need before you can export telemetry from the Gateway or manage it at the API level.
Telemetry export relies on OpenTelemetry Protocol (OTLP) standards, allowing the Gateway to transmit data using HTTP (https://) or gRPC (grpc://, grpcs://) endpoints to external observability backends. Signal streams for Traces, Metrics, and Logs operate independently, letting you route telemetry signals to specialized backends simultaneously, such as sending metrics to Prometheus, traces to Jaeger, and logs to Splunk. Additionally, the Gateway secures vendor request headers containing sensitive authentication credentials (such as API tokens) using write-only encryption, and it minimizes network overhead through Gzip payload compression.
Enabling OpenTelemetry in Gateway settings acts as a hard dependency. If you disable OpenTelemetry globally at the Gateway level, it overrides and suppresses all per-API tracing configurations. Furthermore, modifying global multi-endpoint configurations alters core runtime network pipelines. Because these low-level exporters initialize during startup, changes require an API Gateway restart to establish the new data export logic.
Prerequisites
- Access to the OpenTelemetry Settings settings for your Gateway in API Management.
Configuration steps
You can configure OpenTelemetry from the Platform UI.
-
In API Management, open the Gateway Information settings for your Gateway.
-
Select OpenTelemetry Settings.
-
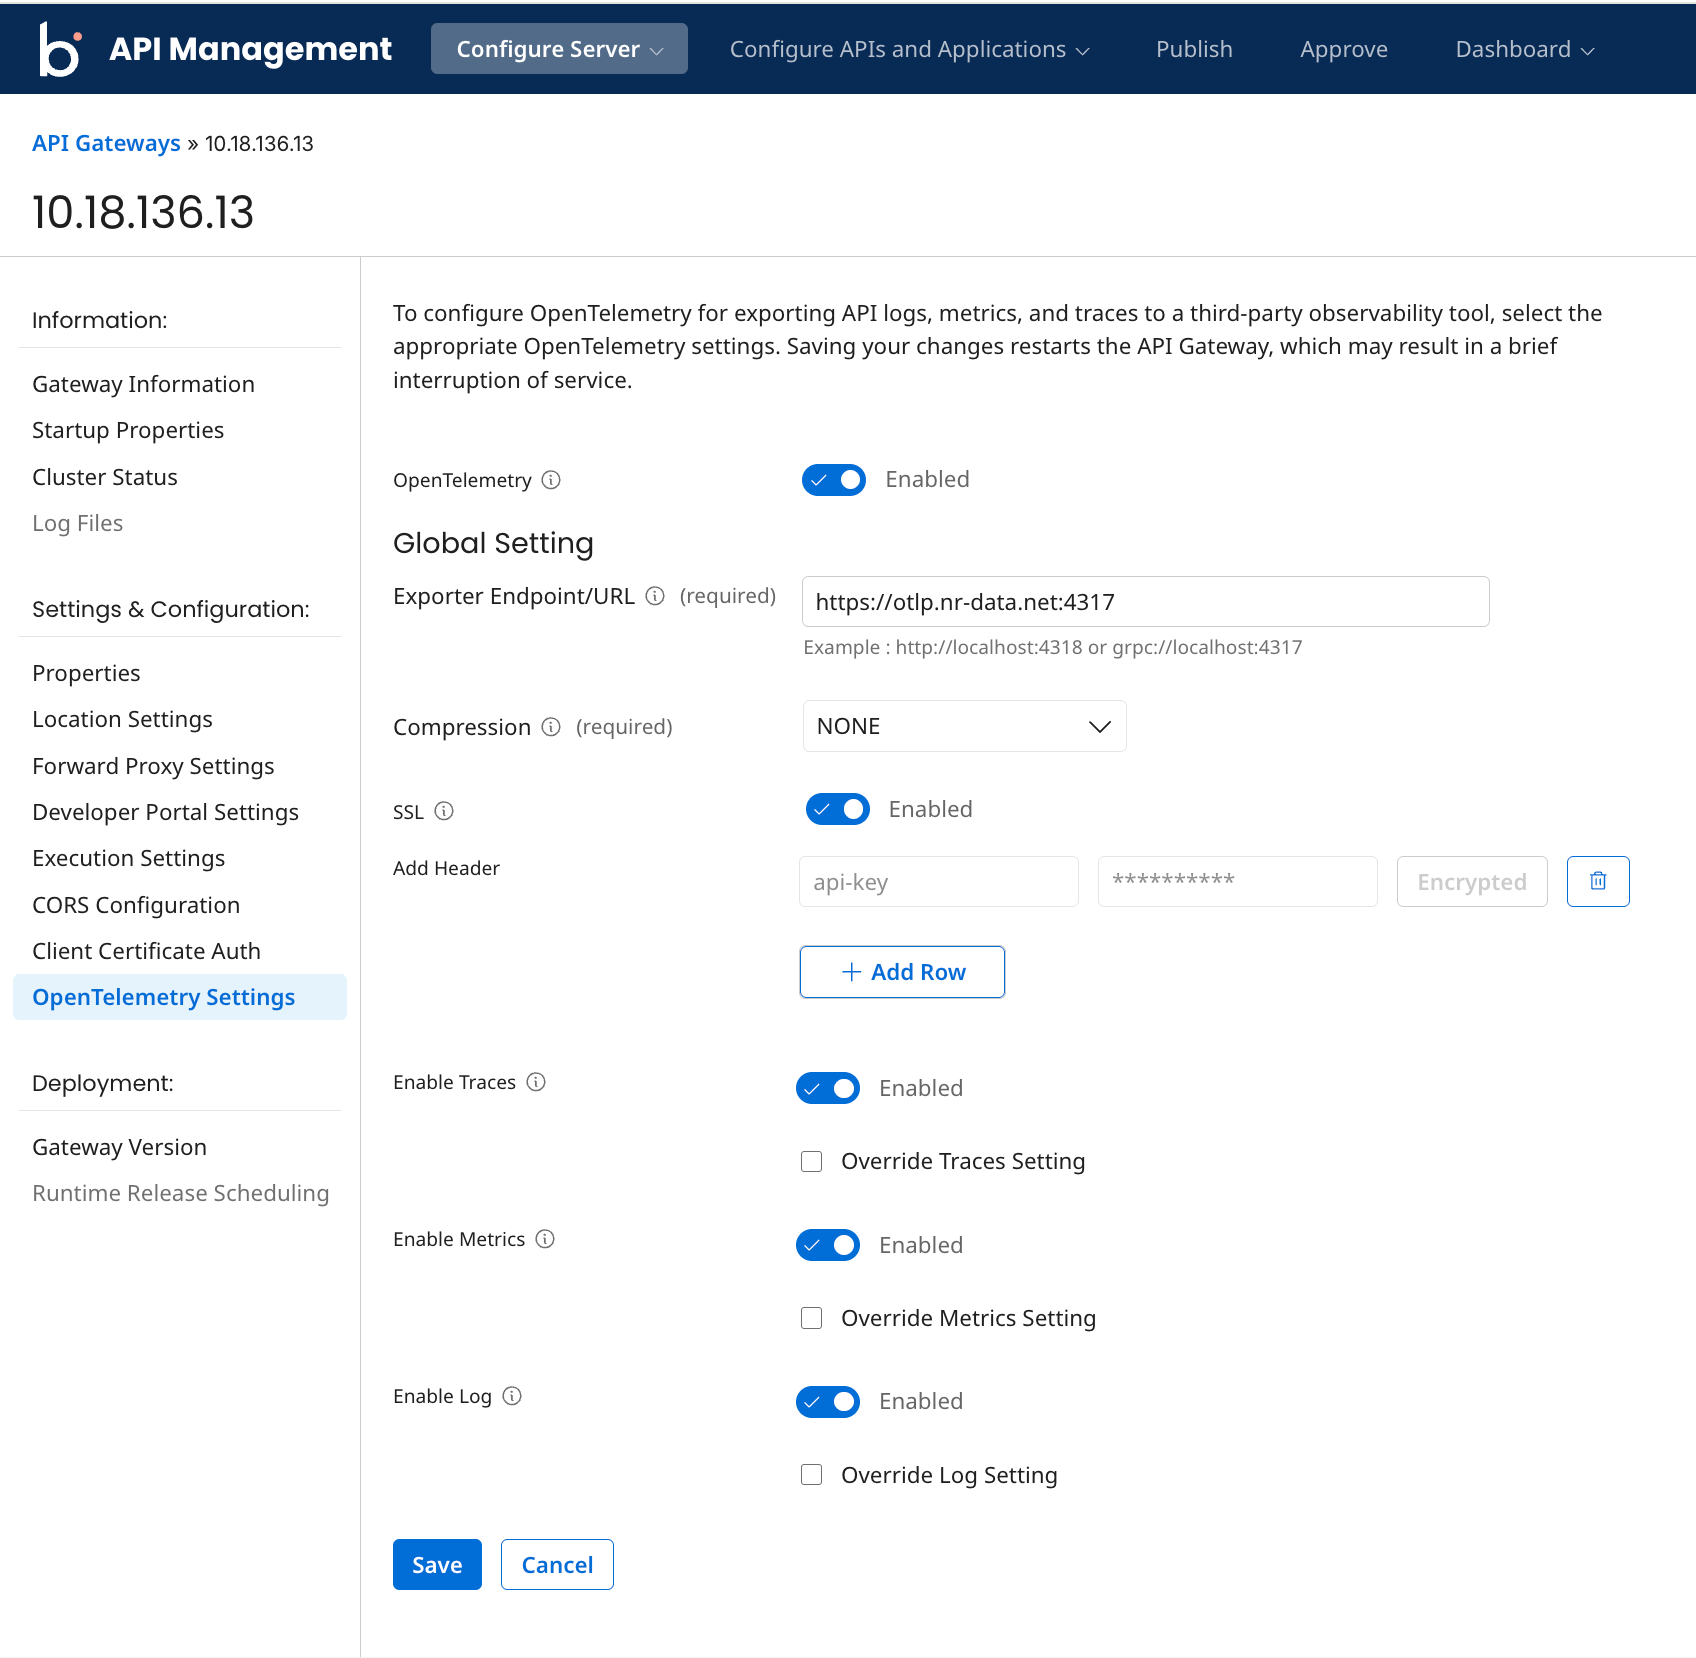
Enable your OpenTelemetry settings for APIs. By default, the status remains disabled.
-
Configure the following:
a. Exporter Endpoint URL - OTel endpoint to which the Gateway exports telemetry data.
Examples:
https://otlp.nr-data.net:4318grpc://otlp.nr-data.net:4317grpcs://otlp.nr-data.net:4317b. Compression - The compression algorithm for data transmission:
- Gzip – This method compresses data before sending it to the configured OTel collector URL, reducing the size of transmitted data.
- None – Sends the data directly without applying any compression.
c. SSL - Enable this if the OTel endpoint uses a secure URL (HTTPS).
d. Add header - This option allows you to add headers to the OTel endpoint requests when sending data to external observability tools. If the observability endpoint requires authentication, you can add the appropriate header.
For instance, to authenticate with an OTel endpoint that requires an API key, you will need to include this header: api-key: xxxxxxxxxxxxxxxxxxxxxx
When adding custom headers to your OpenTelemetry configuration, use the encryption toggle to secure sensitive values. Each key-value pair in the custom header section includes an encrypt option. The Encrypt button remains disabled if either the header key or the value is missing to ensure valid configurations.
For security reasons, if you check the encryption checkbox and save the configuration, you cannot uncheck it for that specific header. To change the value or remove encryption, you must use the "Clear/Reset" action or delete the row.
e. The Multi-Endpoint configuration defines multiple telemetry destinations, enabling the simultaneous routing of specific signal types, such as Traces, Metrics, or Logs, to different providers. Through this interface, you can configure each telemetry type to reach its specialized observability platform. The Global Setting serves as the default when you do not select individual overrides.
-
Enable Traces: Captures end-to-end visibility of API request lifecycles, mapping the flow of an API call through the Gateway. Each span corresponds to a unit of work such as policy execution or request forwarding. The Override Log Setting option allows you to define a unique exporter URL, compression, and SSL settings specifically for trace data. This allows you to route traces to a specialized platform like Jaeger or Tempo independently of other telemetry types.
-
Enable Metrics: Reports performance indicators like CPU and memory usage. The Override Log Setting option allows you to route these performance indicators to a different specialized provider, such as Prometheus or CloudWatch, simultaneously with other signals.
-
Enable Log: Exports API Gateway service logs from all nodes to the OTel endpoint for centralized troubleshooting. The Override Log Setting option allows you to deliver logs to a third-party destination, such as Splunk or ELK. This provides full flexibility without restricting you to a single destination for all data.
-
Save the configuration to apply the settings to your Gateway. Any changes to these multi-endpoint configurations trigger a final confirmation that you must restart the Gateway to apply the new telemetry logic. After the restart, the Gateway starts exporting traces, metrics, and logs to the configured endpoints.
NewRelic observability examples
Visualization of the exported telemetry data depends on the endpoint's capabilities. The following screenshots depict the visualization in the NewRelic tool.
Traces
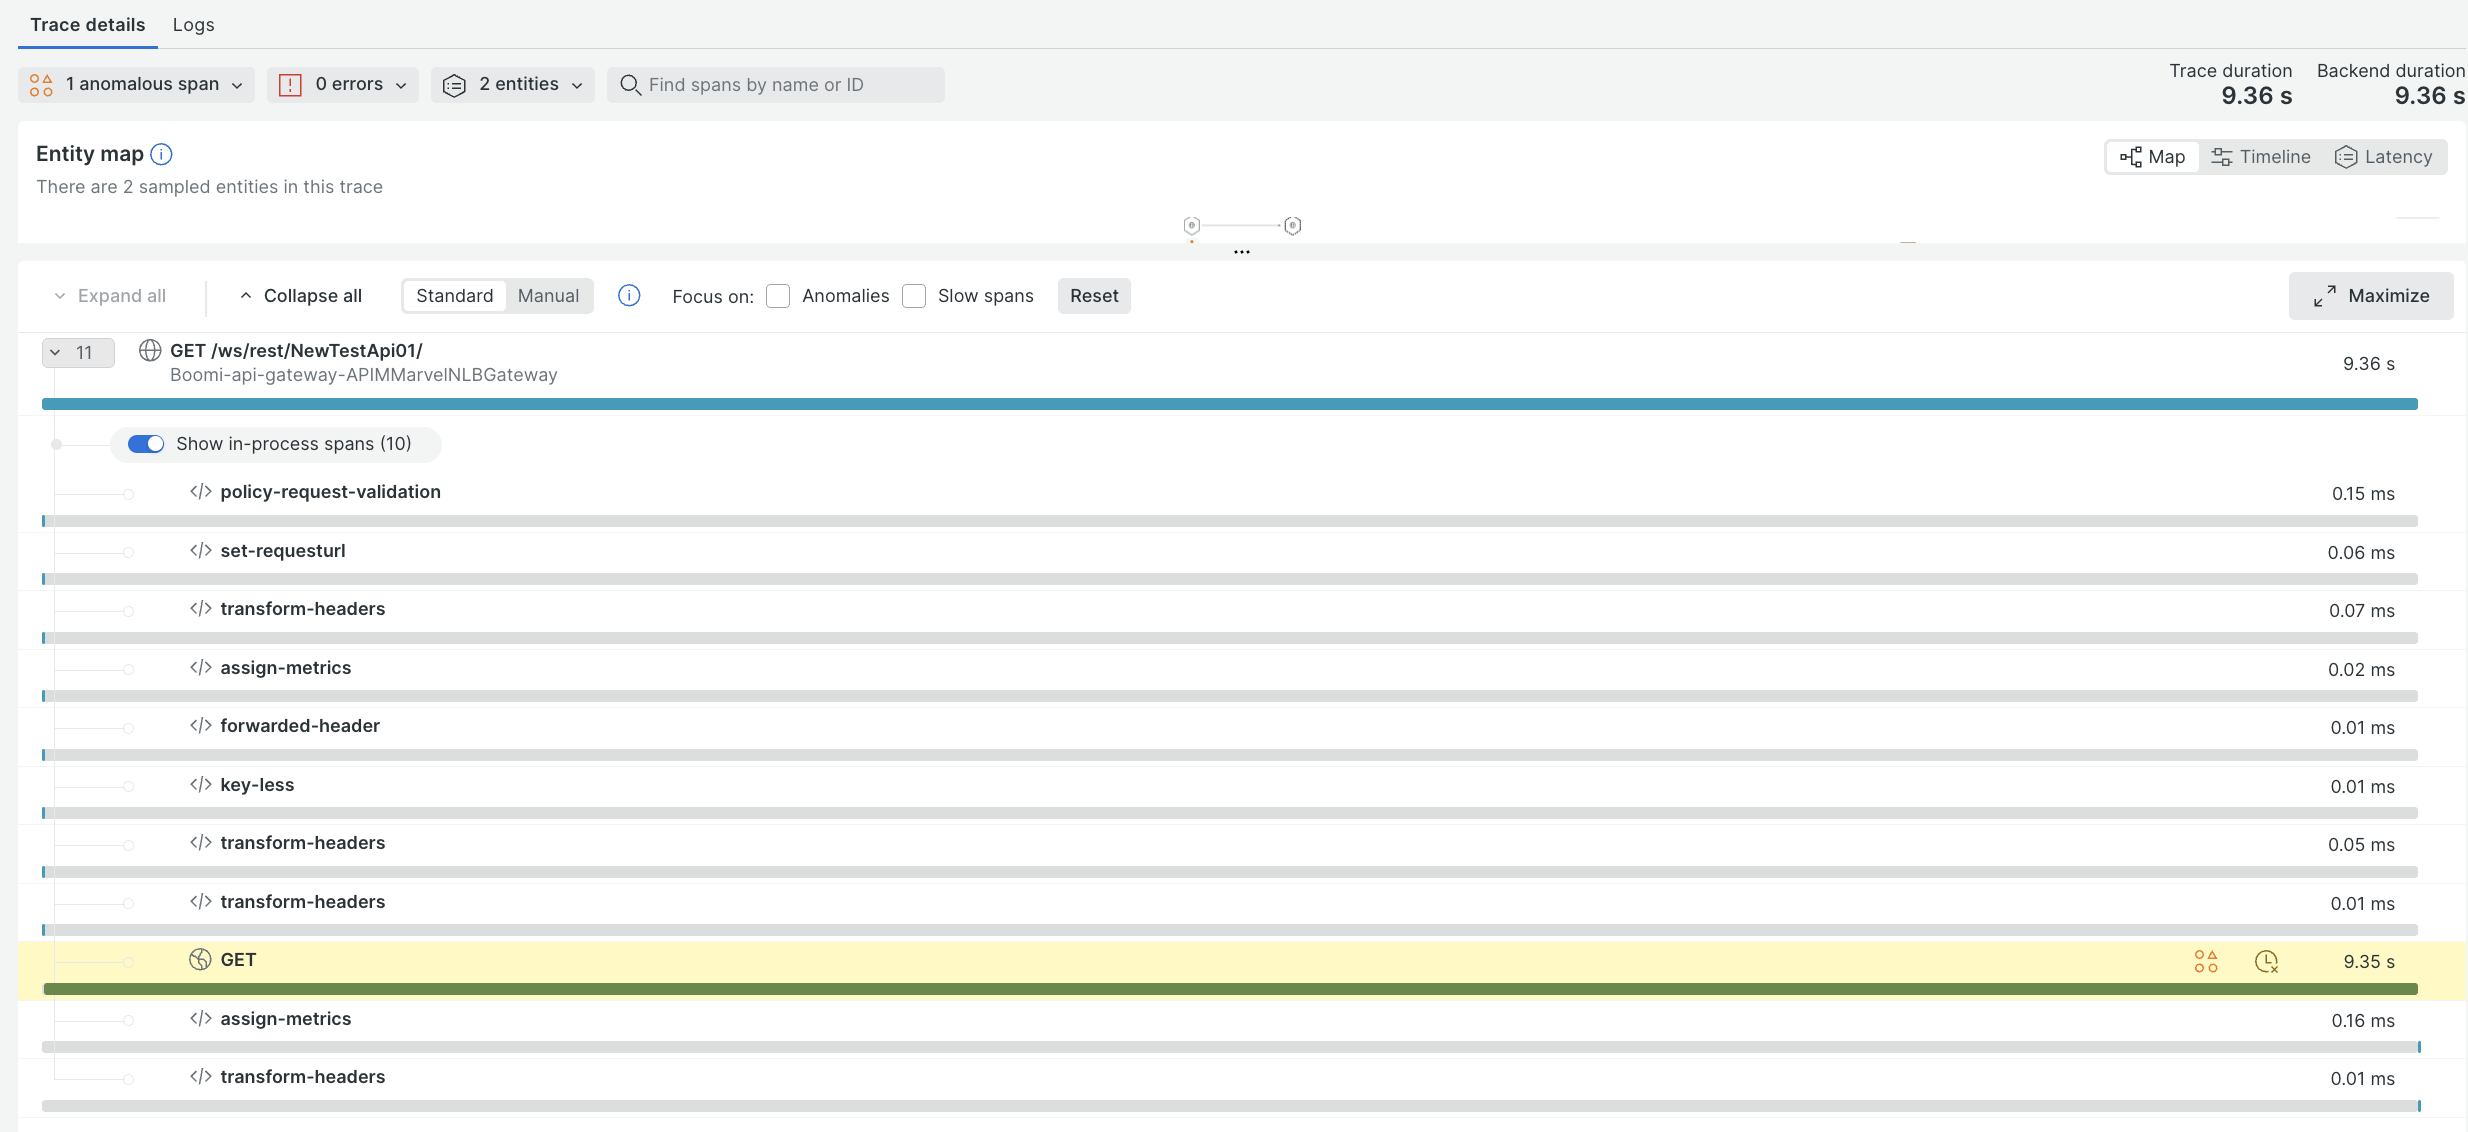
API trace provides a complete view of an API call's journey through the Gateway. It captures the entire flow, including all policy executions, from the request's entry to the final response.
Logs
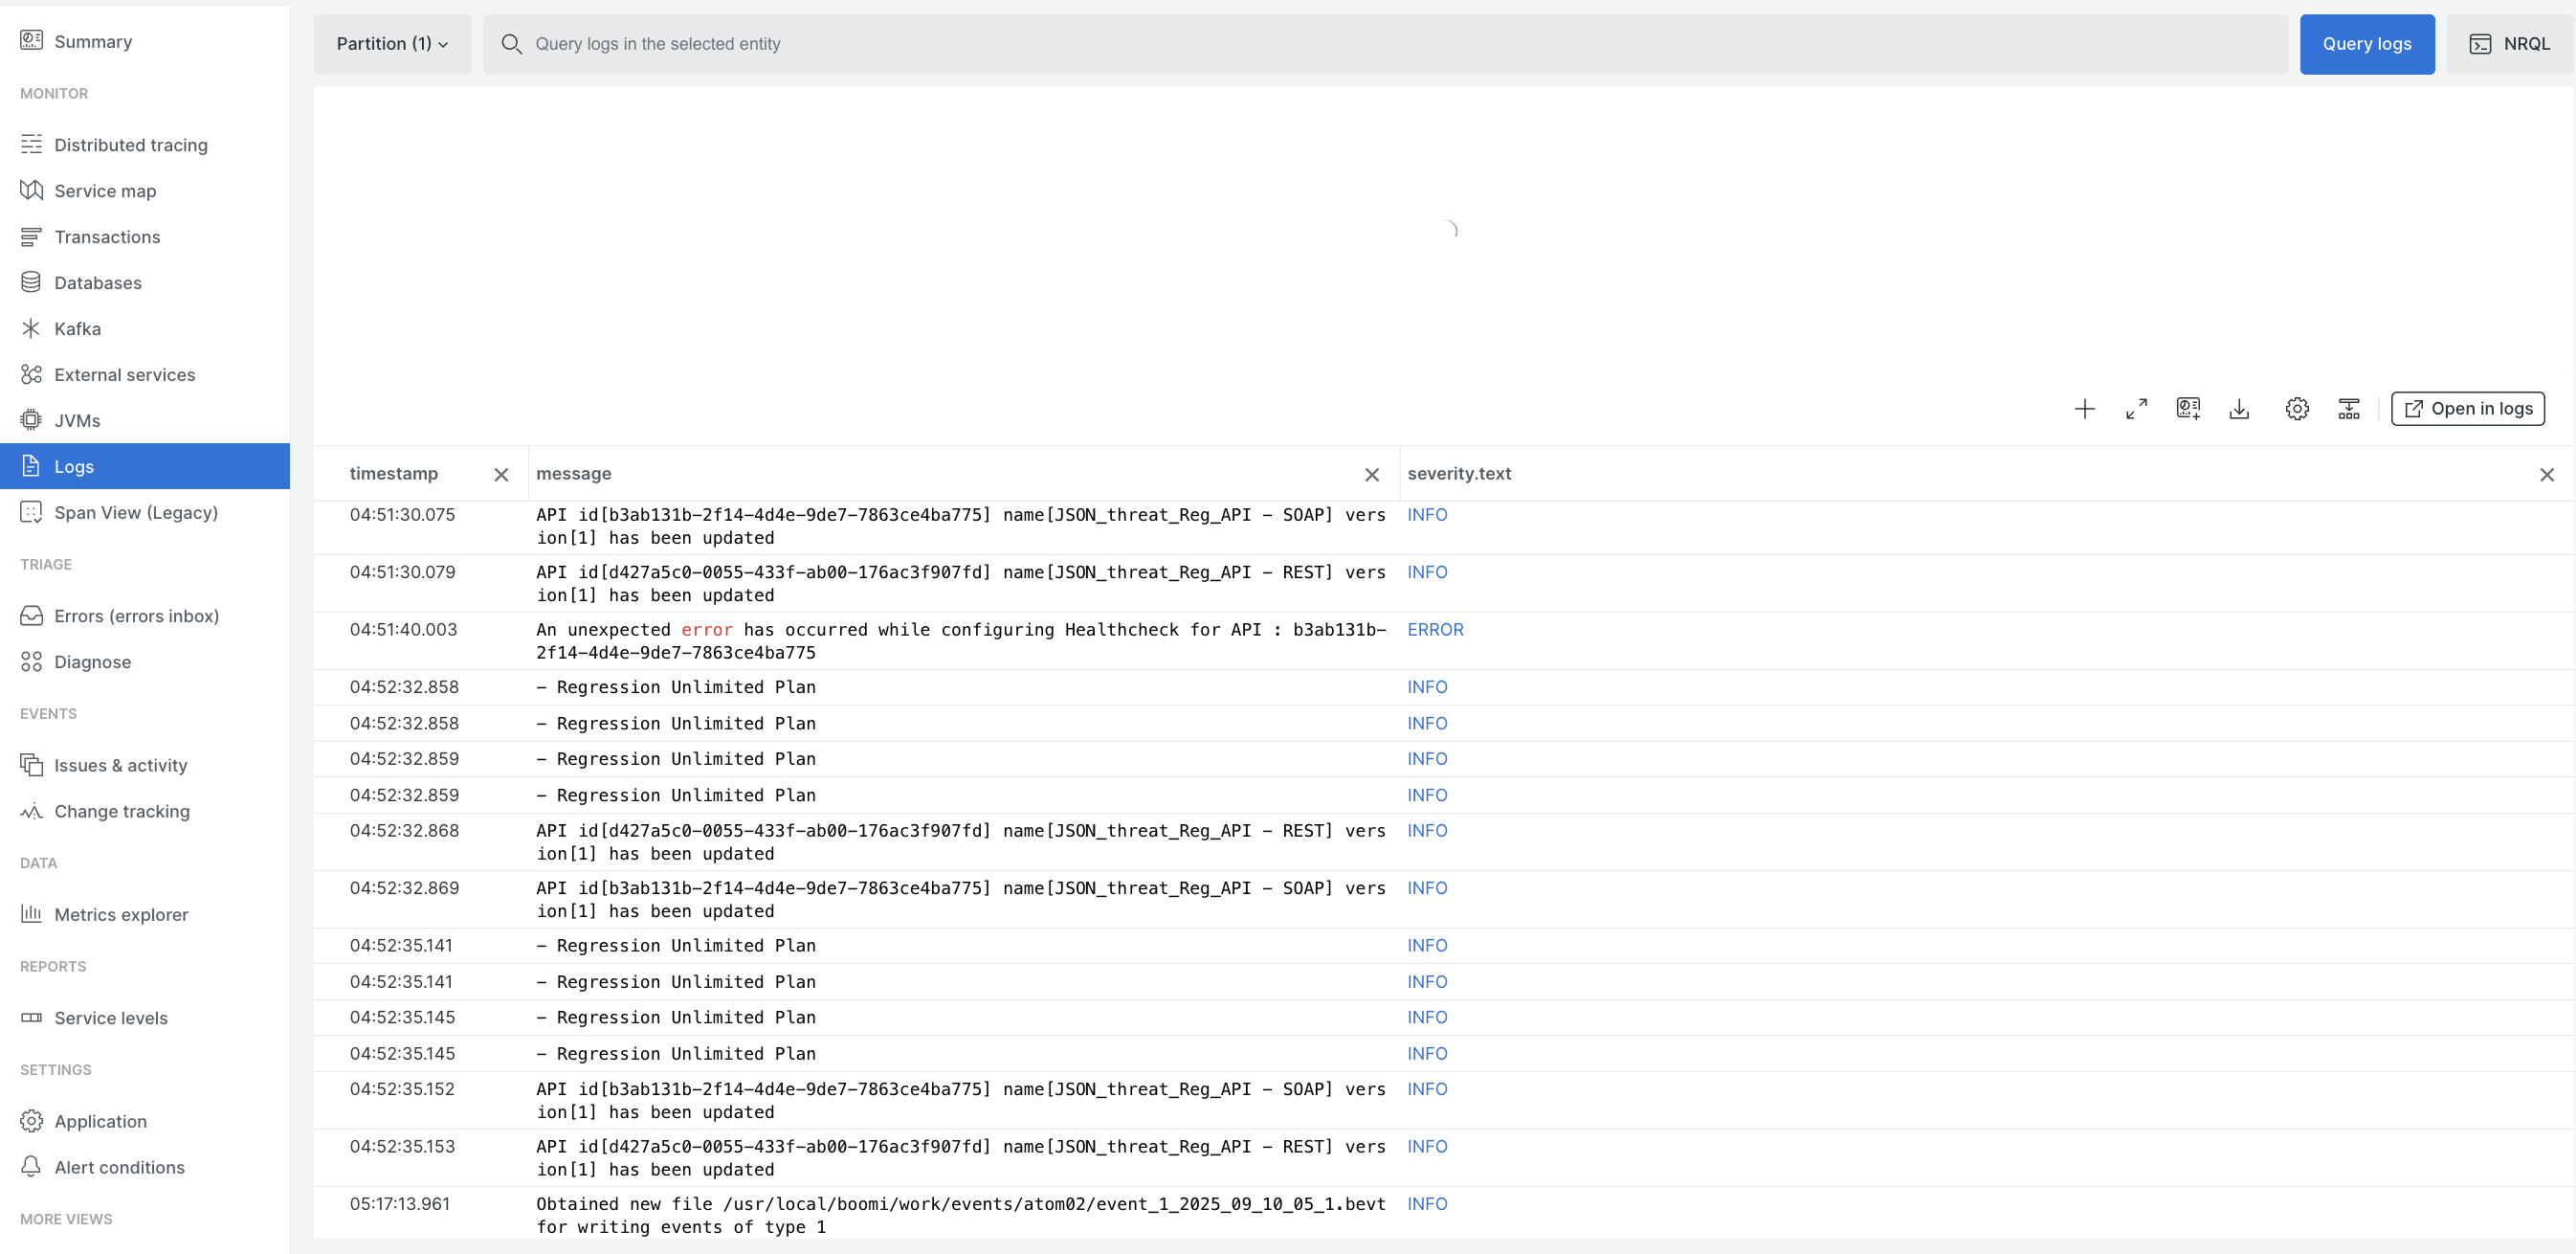
Logs represent the API Gateway logs exported to the OpenTelemetry tool.
Metrics
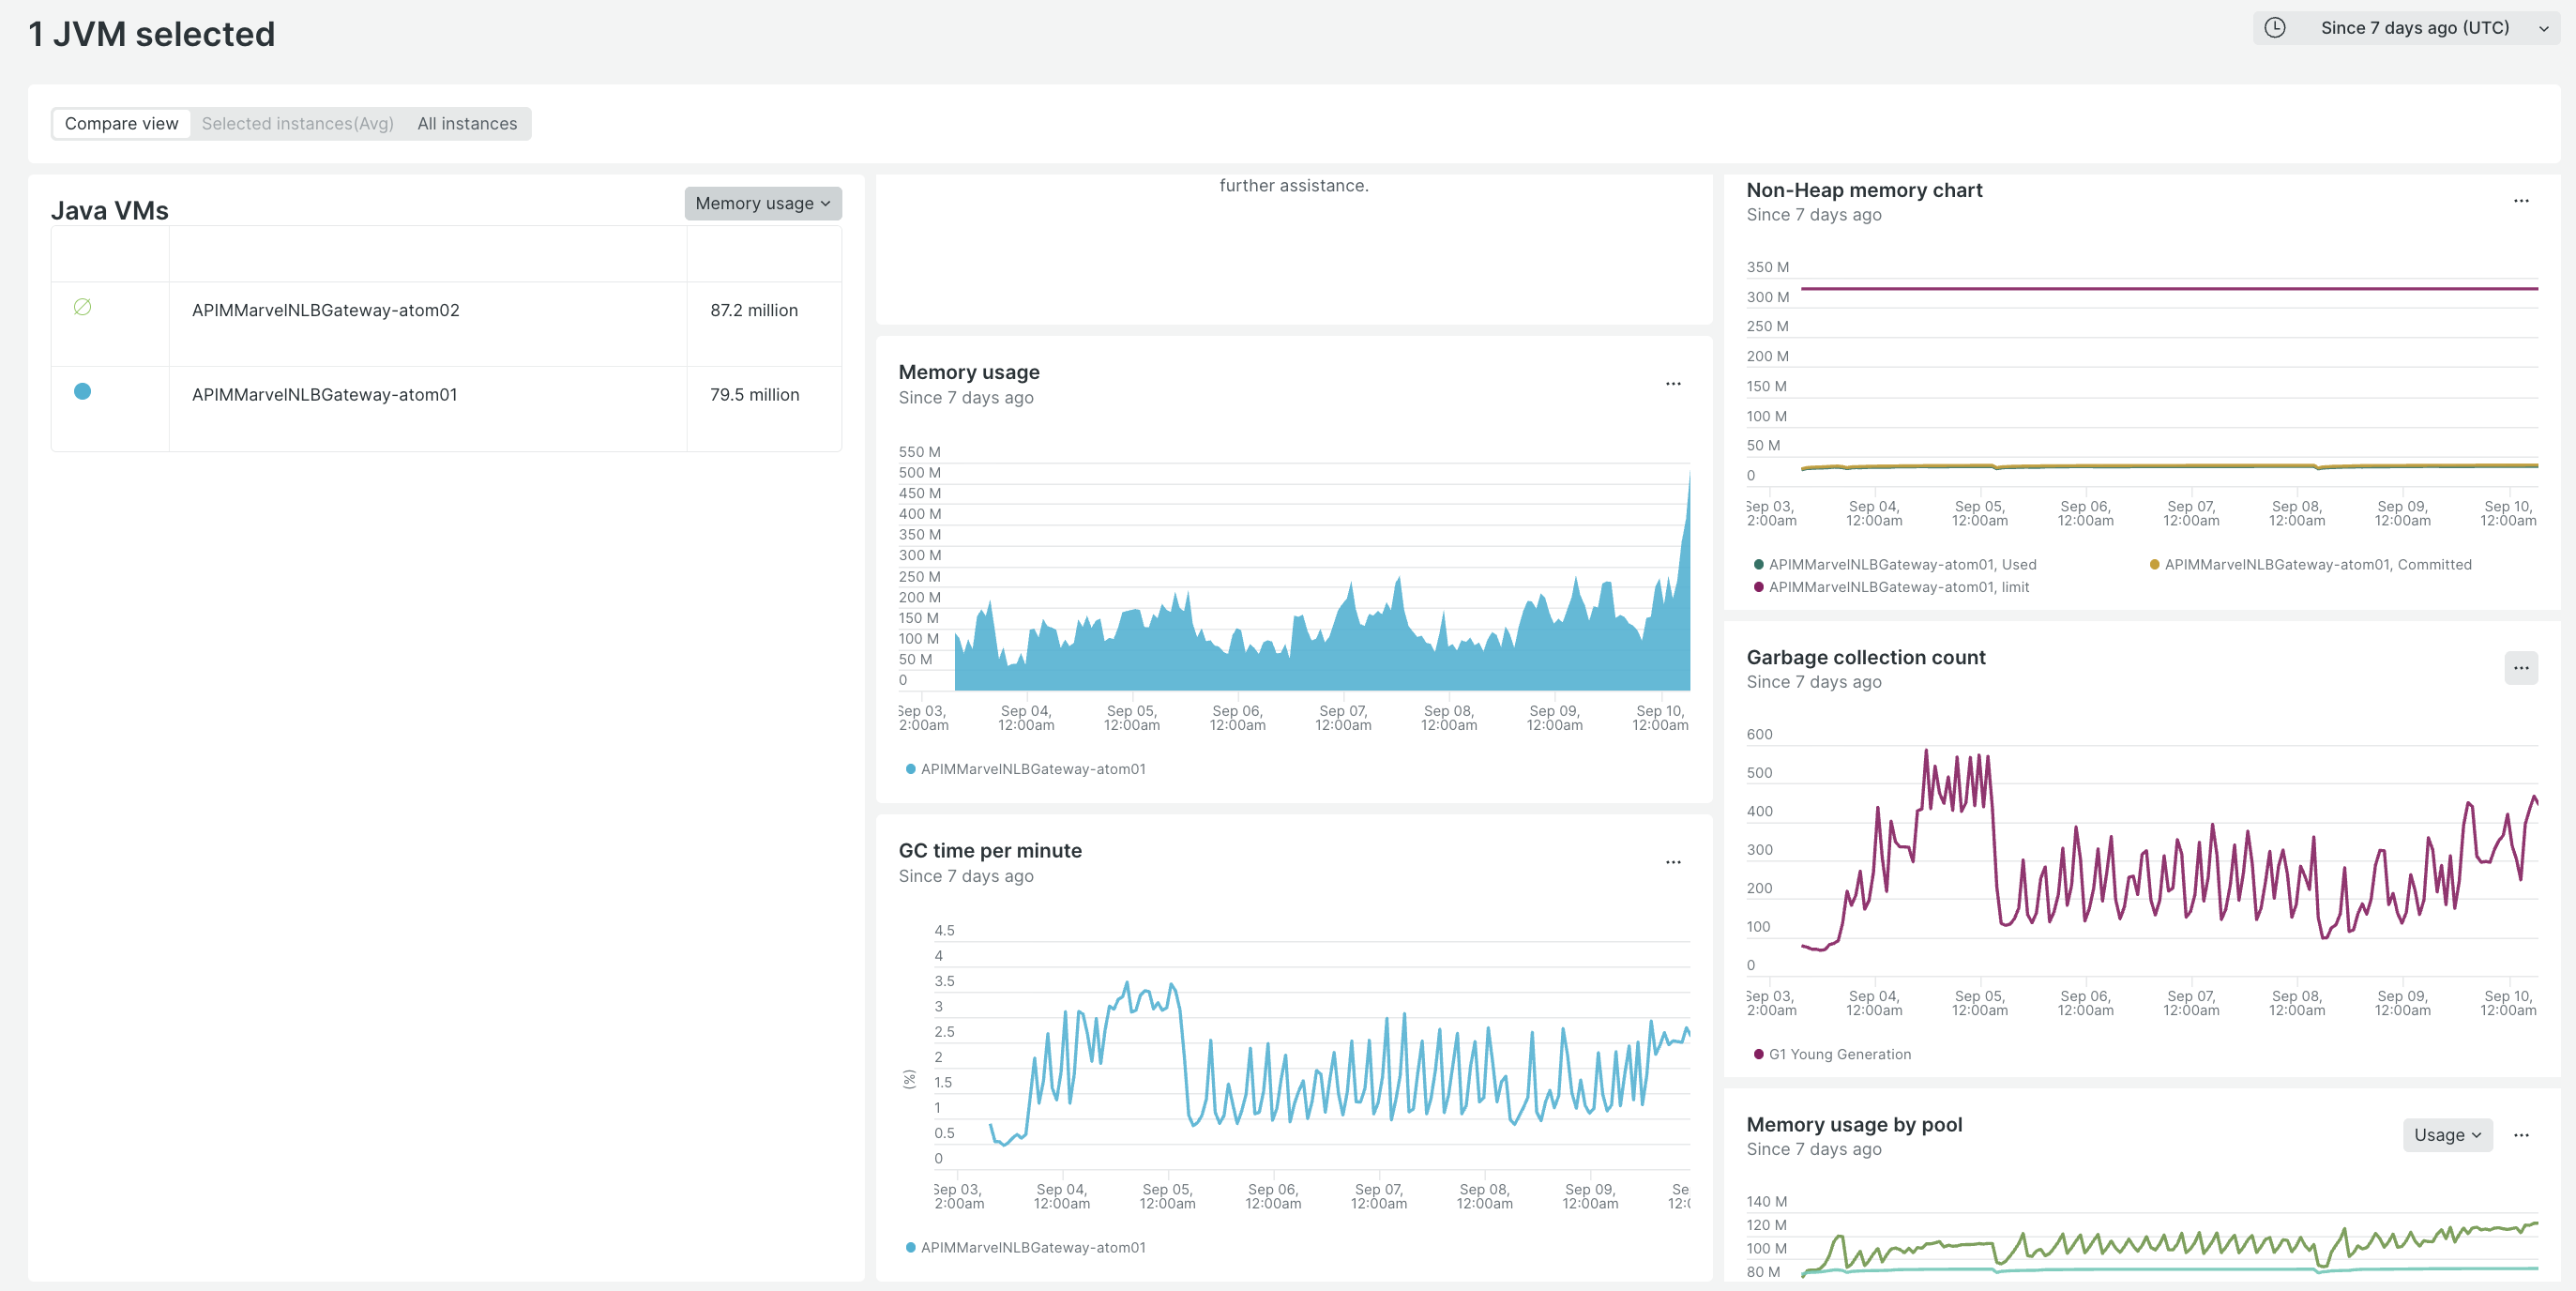
Report performance indicators such as CPU use, memory usage, GC time per minute, and so on.